We can evaluate the adjusted expectation for each canonical direction and determine their corresponding standardised values. To see these we use the cda+ option:
BD>show: cda+ ![]()
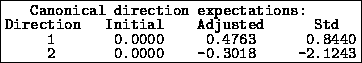
Figure 17: Canonical direction expectations
giving the output shown in figure 17 (We discuss expectations
for the canonical directions in section 5.4.) Each canonical
direction has prior expectation zero and an adjusted expectation for the
data ![]() actually seen. Also shown is the magnitude of the
difference in standard deviations. That is, recalling that each
canonical direction has prior expectation zero, for each direction
actually seen. Also shown is the magnitude of the
difference in standard deviations. That is, recalling that each
canonical direction has prior expectation zero, for each direction
![]() , we see
, we see ![]() ,
, ![]() , and
, and ![]() .
.