![]()
![]() Syntax
Syntax
BD-B
BD*X
BD*Y
BD*R
BD*C
BD*U
BD*V
BD*A
BD*A
BD*
BD*A
BD-B
BD*X
BD*Y
BD*R
BD*C
BD*U
BD*V
where
The GRID: command is used to define various basic features for
the quantities to appear on an influence diagram. Once used, its
essential features can be examined by issuing the LOOK: command
with argument grid , and the TESTGRID: command can be
used to test the design. The command typically is spread over
Notice that we would define
The real numbers input need not necessarily be in the format
suggested. Suppose that there are n nodes being defined. The numeric
information following the GRID: and GRID0: commands
consists of
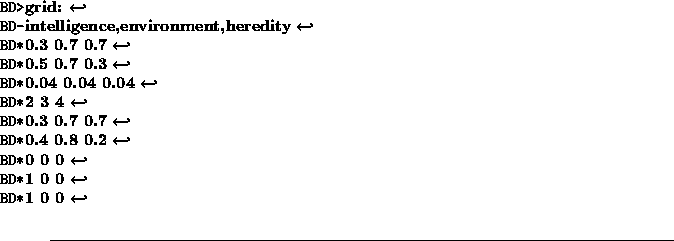
Consider the code given in Figure 11.3 for a fictitious example.
This defines three nodes for collections named intelligence,
environment, and heredity respectively. The nodes are centred at
(0.3,0.5), (0.7,0.7), and (0.7,0.3) respectively; and their names are
placed respectively underneath, above, and underneath the nodes. Each
node will be drawn with a radius equal to 0.04. There are only two
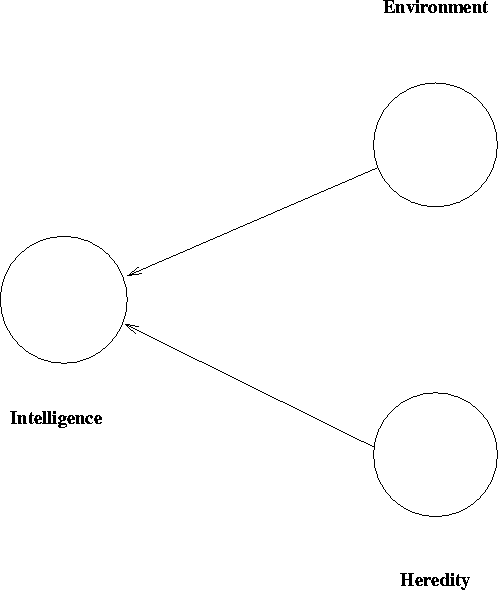
directed arcs, one from the environment node to the intelligence node;
and the other connecting the heredity node to the intelligence node. The
resulting diagram should resemble Figure 11.4.
The GRID0: command is identical to the GRID: command
except that no arcs are defined. This is useful when designing
the partial correlation diagram, as arcs connecting the nodes on such
diagrams are generated according to various other criteria. Notice that
the ARC: command can be used to specify arc connections
piecemeal.
![]() ,B
,B ![]() , ..., B
, ..., B ![]()
![]()
![]() ,X
,X ![]() , ..., X
, ..., X ![]()
![]()
![]() ,Y
,Y ![]() , ..., Y
, ..., Y ![]()
![]()
![]() ,R
,R ![]() , ..., R
, ..., R ![]()
![]()
![]() ,C
,C ![]() , ..., C
, ..., C ![]()
![]()
![]() ,U
,U ![]() , ..., U
, ..., U ![]()
![]()
![]() ,V
,V ![]() , ..., V
, ..., V ![]()
![]()
![]() ,A
,A ![]() , ..., A
, ..., A ![]()
![]()
![]() ,A
,A ![]() , ..., A
, ..., A ![]()
![]()
![]()
![]()
![]() ,A
,A ![]() , ..., A
, ..., A ![]()
![]()
![]() ,B
,B ![]() , ..., B
, ..., B ![]()
![]()
![]() ,X
,X ![]() , ..., X
, ..., X ![]()
![]()
![]() ,Y
,Y ![]() , ..., Y
, ..., Y ![]()
![]()
![]() ,R
,R ![]() , ..., R
, ..., R ![]()
![]()
![]() ,C
,C ![]() , ..., C
, ..., C ![]()
![]()
![]() ,U
,U ![]() , ..., U
, ..., U ![]()
![]()
![]() ,V
,V ![]() , ..., V
, ..., V ![]()
![]()
![]() are the names of n bases or elements;
are the names of n bases or elements;
![]() ,
, ![]() ,
, ![]() ,
, ![]() , and
, and
![]() are real numbers;
are real numbers; ![]() are integers in [1,15];
and
are integers in [1,15];
and ![]() are integers.
L is the name of a label, and C is a valid input
channel number: an integer such that
are integers.
L is the name of a label, and C is a valid input
channel number: an integer such that ![]() .
. ![]()
![]()
![]() [B/D] command lines. For the second form of the command an address is
given, and the remaining
[B/D] command lines. For the second form of the command an address is
given, and the remaining ![]() lines should then be placed following
the given address. The inputs to the command are as follows.
lines should then be placed following
the given address. The inputs to the command are as follows.
![]() locates at
locates at ![]() .
.
![]() will be the radius of the node associated
with the base
will be the radius of the node associated
with the base ![]() . It is possible to indicate here, by setting
. It is possible to indicate here, by setting
![]() , that [B/D] should use it's default radius.
, that [B/D] should use it's default radius.
![]() will be the colour attached to
the node associated with the base
will be the colour attached to
the node associated with the base ![]() . Each value of
. Each value of ![]() is an integer in [1,15], representing a colour. A table showing the
colours represented by these integers is shown in Table 11.3.
The colour give for the node determines (1) the colour used to draw the
node; (2) the colour of any arc leaving the node; (3) the colour used to
shade the outer sectors of any nodes to which there is a directed arc
connected to this node, and which represent collections which are to be
adjusted by this node.
is an integer in [1,15], representing a colour. A table showing the
colours represented by these integers is shown in Table 11.3.
The colour give for the node determines (1) the colour used to draw the
node; (2) the colour of any arc leaving the node; (3) the colour used to
shade the outer sectors of any nodes to which there is a directed arc
connected to this node, and which represent collections which are to be
adjusted by this node.
![]() will be located at
will be located at
![]() .
.
![]() :
:
![]() is an integer
between 0 and 31 inclusive which will set the type of the arc
drawn from node
is an integer
between 0 and 31 inclusive which will set the type of the arc
drawn from node ![]() to node
to node ![]() . The possible values and their
meanings are shown in Table 11.4. An arc can consist of (1) a
path correlation, if appropriate; (2) a label summarising arc influence;
and (3) the arc itself: a directed straight line connecting two nodes.
In addition, two further styles may be selected: (4) the arc information can
be made to be proportional either to the actual resolution at a
destination node, or to the overall uncertainty at the destination node; and
(5) arc diagnostic information only might be shown.
These possibiliies may be selected separately. An integer in
. The possible values and their
meanings are shown in Table 11.4. An arc can consist of (1) a
path correlation, if appropriate; (2) a label summarising arc influence;
and (3) the arc itself: a directed straight line connecting two nodes.
In addition, two further styles may be selected: (4) the arc information can
be made to be proportional either to the actual resolution at a
destination node, or to the overall uncertainty at the destination node; and
(5) arc diagnostic information only might be shown.
These possibiliies may be selected separately. An integer in ![]() is used to set
the arc type. The binary representation of this integer
is used to determine what possibilities are selected. The integer has a
5 bit binary representation, with a bit equal to 1 if a style is
selected, and 0 otherwise. For example, arc style 19 (10011 binary)
has the first, second, and fifth style bits set, and
consists of a straight line and a label, and the labelling information
is primarily diagnostic.
is used to set
the arc type. The binary representation of this integer
is used to determine what possibilities are selected. The integer has a
5 bit binary representation, with a bit equal to 1 if a style is
selected, and 0 otherwise. For example, arc style 19 (10011 binary)
has the first, second, and fifth style bits set, and
consists of a straight line and a label, and the labelling information
is primarily diagnostic.
![]() and
and ![]() to draw an
arc from node
to draw an
arc from node ![]() to node
to node ![]() . If
. If ![]() then, if
appropriate, the information concerning arc influence and a diagnostic
quantity will be drawn in the form of a bar overlaying part of the arc.
then, if
appropriate, the information concerning arc influence and a diagnostic
quantity will be drawn in the form of a bar overlaying part of the arc.
![]() and
and ![]() real numbers respectively. These
numbers must be supplied in the order indicated, but you are free to
split the input over several lines, as many numbers per line as you wish
(possibly interspersed with blank lines) subject to the usual limitation
of no more than 253 characters per physical line. A number must not be
split over two or more lines. Any input on the same physical line as
the last number required will be ignored.
real numbers respectively. These
numbers must be supplied in the order indicated, but you are free to
split the input over several lines, as many numbers per line as you wish
(possibly interspersed with blank lines) subject to the usual limitation
of no more than 253 characters per physical line. A number must not be
split over two or more lines. Any input on the same physical line as
the last number required will be ignored.

Figure 11.3: Example influence diagram design

Figure 11.4: A crude influence diagram