Project IV: Statistics for network data
Jonathan Cumming
Networks and network structures can be found all around us in the form of the Internet, Facebook and Twitter networks, social networks and interactions, and transport systems and connections. In the sciences, they can be used to describe protein- and gene-interaction networks, ecological networks of interacting species, connections between neurons in the brain, and pathways of infection for communicable. At the simplest level, a network describes the pairwise connections (or interactions) between a set of objects. Mathematically, however, we would represent each of these networks as a graph where the objects are vertices (nodes), and an edge is placed between two vertices if they are connected to each other.
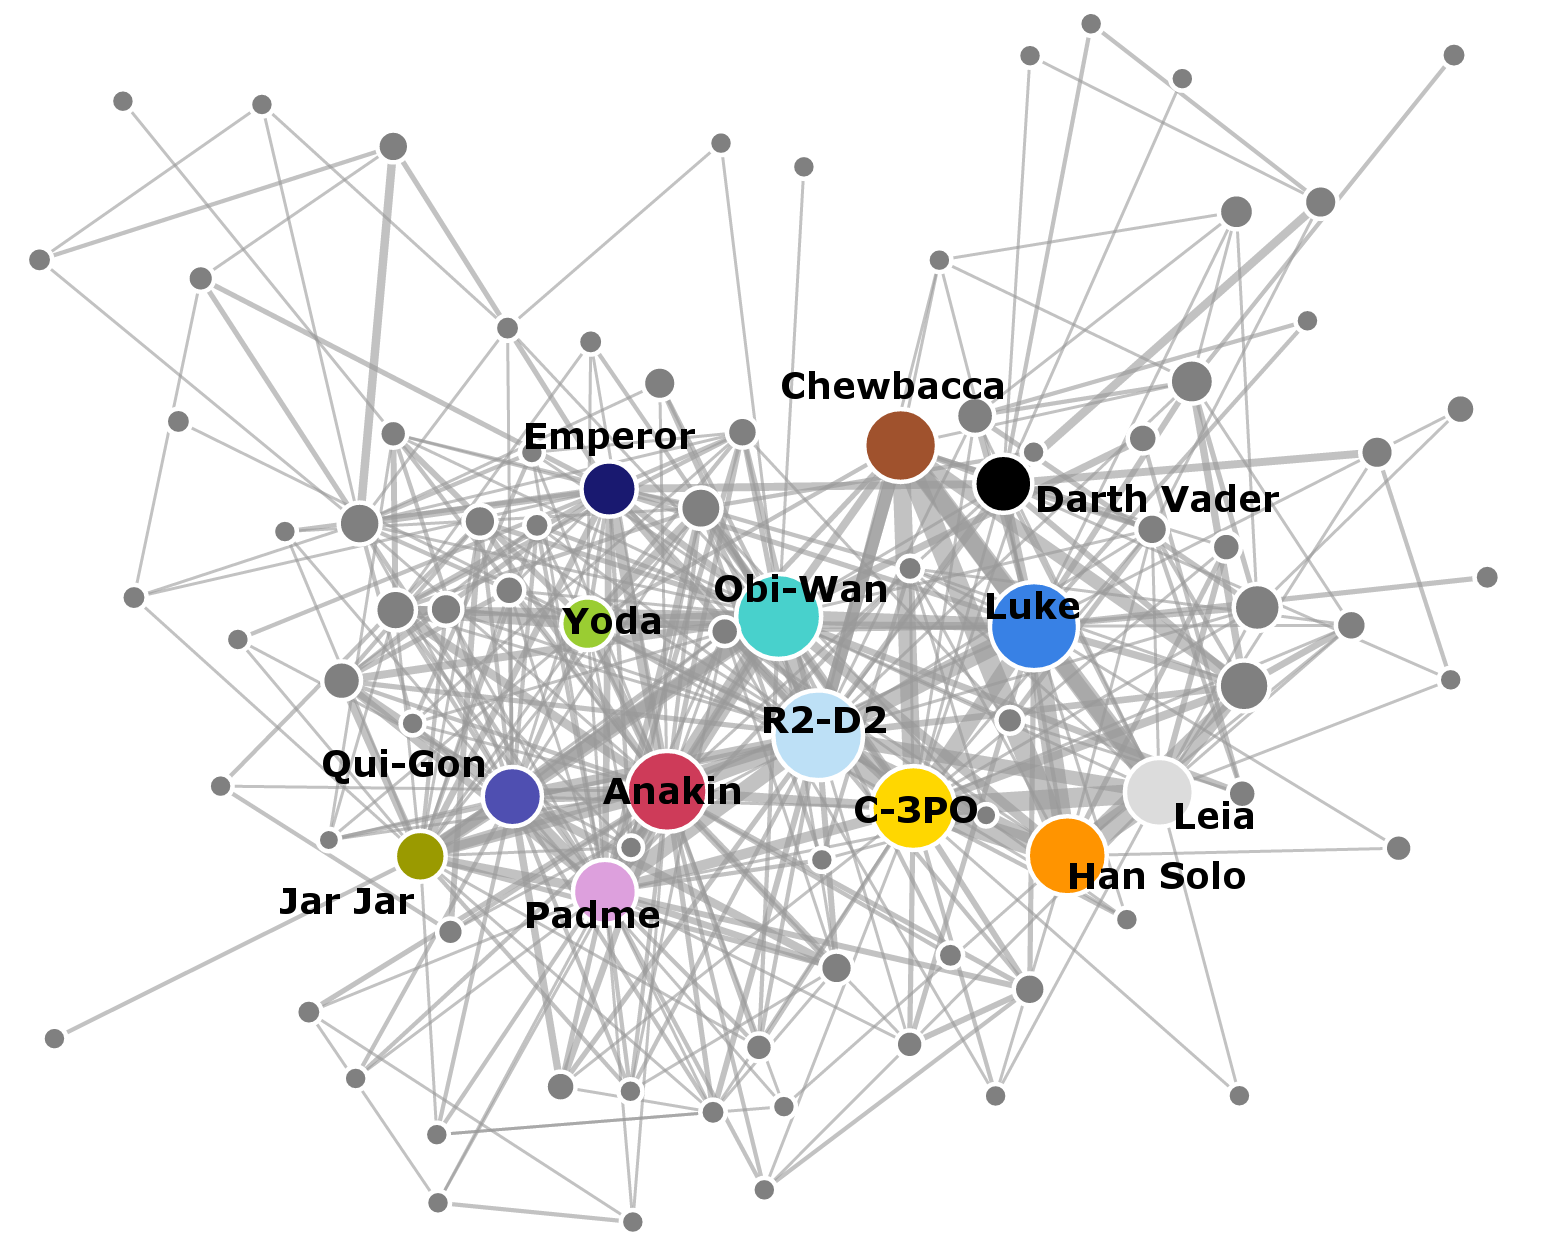
Network of interactions between characters in the first six Star Wars movies. Edges are weighted by the frequency of interactions.
Our first challenge will be to transform a network into a numerical format we can manipulate and visualise. The simplest representation of the structure of a network is the adjacency matrix, \(A\), which is a square matrix that takes the value \(1\) in position \((i,j)\) if node \(i\) and node \(j\) are connected and zero otherwise. This idea can also be generalised to add ‘weight’ to indicate the strength of the connection.
Given this representation, we can begin to construct simple descriptive summaries to try and characterise aspects of the network’s structure: importance measures of individual vertices and edges; overall measures of cohesion and connectivity; presence of subgraphs, clusters, or cliques. To model a network, we must specify (and fit) a probability distribution over the network graph that in some way represents the mechanism that generated it. Network graph models tend to loosely separate into (i) more probabilistic/mathematical models, and (ii) more statistical models. The mathematical models are often based on ideas such as the theory of random graphs, but don’t lend themselves as easily to statistical operations like model fitting and analysis. A more statistical approach would be exponential random graph models (ERGMs), which have connections to generalised linear models (GLMs).
After developing an understanding of the basic concepts and fundamental statistical models for spatial data, you may then take the project in whatever direction you find most interesting, which might include going deeper into study of particular methods, or focussing on analysis of a real-world data set.
This project has a focus on statistical methodology and data analysis. Familiarity with the statistical package R (or equivalent languages such as Python), general statistical concepts, and data analysis are essential.
Essential prior knowledge
- Statistical Inference II - for familiarity with standard statistical ideas and experience with R.
- Advanced Statistical Modelling III - for generalised linear models
Modules with elements of graph theory may be helpful for context (e.g. Discrete Mathematics 1) but are by no means essential. The focus of the project will be statistical, rather than graph theoretic or probabilistic.
Further reading
This is a specialised topic, though there are a few books that give a treatment of the subject matter.
- Kolaczyk (2009), Statistical Analysis of Network Data: Methods and Models
- Kolaczyk & Csárdi (2013), Statistical Analysis of Network Data with R
- Lusher, Koskinen, Robins (2013), Exponential random graph models for social networks : theory, methods, and applications.
- iGraph R package: https://igraph.org