Statistics and Data Science for Text Data - Jonathan Cumming
Description
It is estimated that there is about 1.8 zettabytes (1.8 trillion GB) of data today, and that 70-80% of that data is unstructured (text documents, notes, comments, surveys with free-text fields, medical charts). While that data is out there, the real problem is not the amount of information but our inability to process it. Text documents are particularly challenging for mathematical approaches since language is ambiguous, context-dependent and riddled with inconsistencies and other problems (such as synonyms, homographs, etc).
The first challenge to any modelling of text data is to transform the textual information into an appropriate numerical data format that allows us to apply statistical techniques. The simplest approach is to turn a document into a vector of word frequencies, and so a collection of documents simply becomes a collection of observations of word counts over a particular vocabulary (though things are more complicated than that). For example below, we have taken the text of the Project 3 descriptions from 2015 and reduced each topic to a vector of word frequencies. After some simple processing and normalising, we can represent the most common word frequencies graphically (left), or as a projection into a 2-D numerical space (right). Even using such a simple and aggressive dimension reduction, we begin to see separations between topics on different subjects based on word usage. A more sophisticated version of this representation is illustrated by methods such as word2vec which attempts to capture both information on what words were used in the document, but also to position words with similar meanings close together in the vector space.
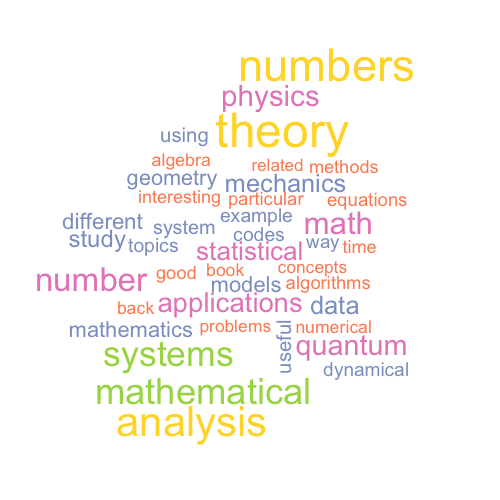
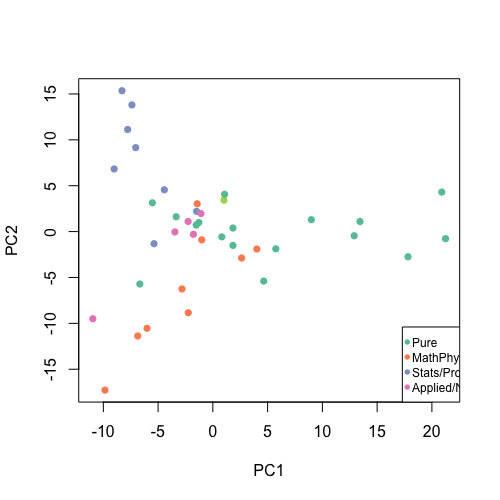
Word cloud (left) for 2015's Project 3 topics based on word frequency, and (right) 2-D projection of topics by area of mathematics.
We will begin by studying how we can treat textual information as data, which we can understand and model with appropriate statistical techniques. We will apply these techniques to collections of text data (such as webpages, online news articles, or tweets), and once reduced to numerical form, we can apply standard statistical methods to explore, build models, find structure and label documents, identify similar documents, predict the type or topic of new documents, and so on. An interesting development from this basis would be to identify and explore 'trending' topics (such as Brexit, Covid, or Black Lives Matter among news articles).
General statistical topics we could consider include:
- Time series analysis of documents to investigate popularity over time to identify trending topics
- Clustering and classification - identifying and predicting the category of a document based on numerical summaries of the text data. In particular, recursive partitioning methods such as classification and regression trees.
- Topic modelling - building a formal statistical model for the category of the document based on its topic, and the latent Dirichlet allocation model.
- Sentiment analysis - where we seek to classify documents according to underlying sentiment. For example, distinguishing positive, neutral and negative online reviews from their text content.
- Investigating different statistical models for language, such as bag-of-words and n-grams.
Prerequisites/Corequisites
Statistical Inference II.
Would be nice/could be useful
Statistical Modelling II, Data Science & Statistical Computing II.
Further information
- Linked wikipedia pages in the text above.
- Foundations of statistical natural language processing, Manning & Schutze (and/or similar).
- Text mining and topic models
- Bag of Words Meets Bags of Popcorn - a tutorial on natural language processing using IMDB film reviews (perhaps more machine learning than statistics).
- The R Task View on natural language processing overviews useful packages in this area.