Project IV: Graphical Models in Multivariate Statistics - Jonathan Cumming
Description
A graphical model is a particular type of multivariate statistical model that uses graphs (the mathematical object comprising nodes and edges) to represent the variables and relationships within the model. A graphical model encodes such problems by representing the variables as the nodes of the graph, and the relationships between pairs of variables as edges representing statements of conditional dependence. Underlying this graph structure is then a joint multivariate distribution, which provides the basis for statistical inference. Realistic problems in statistics are characterised by the presence of multiple variables and a complex web of relationships between them, which makes graphical models potentially very useful tools in the statistician's toolbox.
Graphical models come in a variety of flavours depending on whether we assign a direction to the edges of the graph. Directed graphs lend themselves to a Bayesian treatment and so are often known as Bayesian networks, whereas undirected graphical models, also known as Markov random fields, often follow a frequentist approach based on likelihood and parameter estimation. Continuous and discrete-valued data must also be handled differently using methods based on the multivariate Normal distribution and log-linear models respectively.
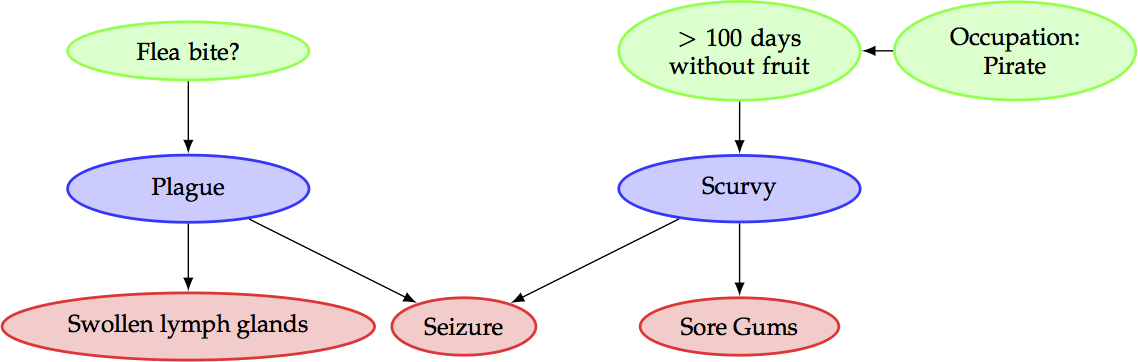
A simplified Bayesian network model for the diagnosis of scurvy and
plague.
Graphical modelling is a versatile technique which has been used in a wide range of application domains, including: decision support, medical and fault diagnosis, web search, image analysis, speech recognition, natural language processing, decoding of messages sent over a noisy communication channel, and robot navigation.
In this project, we will begin by studying how multivariate statistical problems can be expressed as graphical models, investigate Graphical Gaussian models for multivariate Normally-distributed data, and apply this knowledge to the analysis of real data sets.
There are then many further topics which you could pursue depending your interest. Some examples would be:
- Graphical modelling methods for discrete- and mixed-valued data - moving beyond the graphical Gaussian model to look at how categorical variables can be introduced
- Directed graphical models and Bayesian networks - introducing direction to the edges of the graph
- Learning the structure of a graphical model from data - looking at how to identify the presence of relationships between variables (and hence edges between nodes) from the data
- Parameter estimation, and fitting a given graphical structure to data - investigating the mathematical detail of identifying the 'best' model for a given data set
- Applications of graphical models to substantive problems. Some examples include.
- Image analysis - images can be treated as graphical models, with a node for each pixel and each node connected to its immediate neighbours. Thus models based on Markov random fields are commonly used (see for example, the excellently-titled On the Statistical Analysis of Dirty Pictures for an application to image restoration).
- Decision support - directed graphical models (such as the example above) can be useful for in problems of medical diagnostics, as well as identifying potential causes of failure in more mundane systems
- Natural language - graphical models can be effectively used in a variety of ways to model the structure of language. For example, Topic models can be used to predict an unseen document's topic, Markov and Hidden Markov models can be used to predict the next word in predictive text.
This project has a focus on statistical methodology and data analysis. Familiarity with the statistical package R, general statistical concepts, and data analysis are essential.
Prerequisites
Statistical Concepts II, Statistical Methods III
Would be nice/might help, but not essential
Bayesian Statistics III/IV
Web Resources
- The wikipedia pages on Graphical models, Bayesian networks, and Markov random fields are a good starting point
- The R task view on graphical modelling gives a comprehensive list of relevant R packages.
Books
Many books contain suitable introductory material:
- Probabilistic Graphical Models by Koller and Friedman gives a textbook treatment of the subject.
- Graphical Models with R focuses on the practical details of using these methods in R. An online tutorial version of this book gives a brief practical overview of the same material.
- The library has several books on this topic. See here.
- Graphical models by Lauritzen delves rather deeper into the theory. Not for the faint-hearted!