Project III: Clustering and Unsupervised Learning - Jonathan Cumming
Cluster analysis or clustering is an exploratory statistical technique which is used to identify natural groupings within a large number of observations. Discovering that there are sub-groups in the data is often valuable information, particularly if the different groups of observations have different properties or behaviours - or else we risk falling into the trap of Simpson's paradox. Clustering as a methodology also comes under the heading of unsupervised learning, as the goal is to try and identify the structure of the data set without any guidance as to how many clusters there are, what shape they have, or where they may be located.
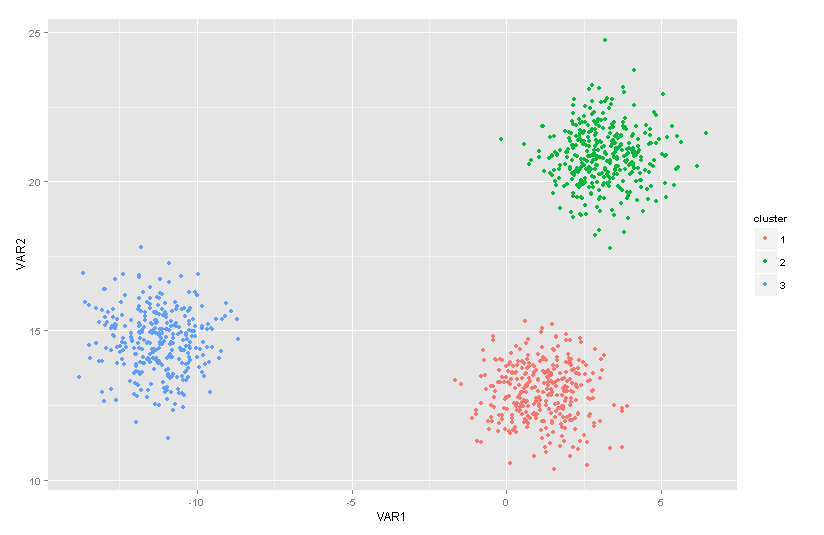
A simple example of a data set with three distinct clusters.
Simple methods for clustering seek to identify sub-groups of the observations which are "similar" to other observations in the same group, but "different" from data in other groups. These groups then constitute the clusters within the data. Clearly, the definition of "similarity" between our data points is a crucial one and our results will vary depending on our choices. A standard route is to define similarity in terms of the Euclidean distance between the data points, which leads to simple methods such as k-Means (animation of k-means in action). A more rigorous approach than k-means would assume that each cluster in the data is represented by a multivariate probability distribution, making the clustering problem one of dealing with a finite mixture model.
A completely different approach to clustering uses decision trees, which progressively divide the data into the "most dissimilar" groups via simple tests on the individual variables. This process then repeats, dividing and sub-dividing the groups until we're left with single data points at the leaves of this hierarchical tree structure. Conversely, we could apply the same in reverse, and progressively merge the "most similar" points into clusters, and then merge the clusters. Beyond this, there are a wide variety of alternative ways you can define "similarity", or even a "cluster", and this leads to an equally broad spectrum of methods which seek to discover these features.
Clustering is widely-applied in the sciences and in the wider world, making it a useful method in any statistician's toolbox. For example: in biology, analysing genetic information to identify groups of genes related to a particular genetic disease; in marketing, analysing similar purchases during online shopping to make recommendations; in computer science, analysing characteristics of internet connections to distinguish valid activity from hacking attempts; in digital commerce, identifying groups of customers with similar behaviours and interests; in medicine and health, finding cohorts of patients with similar treatment needs or similar outcomes after treatment.
In this project, we will being with the key concepts behind cluster analysis - the ideas of distance and similarity. We will investigate k-means, and apply this knowledge to the analysis of real data sets. From there, you will study and implement some standard clustering methods, and evaluate their strengths and weaknesses through application to data. Further topics for study could include:
- Classification - given a clustering of the data, how do we predict to which cluster (if any) a new observation will belong? This is the classification problem.
- Cluster shape - particular methods may favour identifying clusters of a particular geometry. For example, anything based on a Normal/Gaussian distribution will easily identify elliptical clusters, but will struggle when our data have more complex structure./
- Non-numerical data - similarity measures based on Euclidean (or similar) distances require all the variables to be numerical. How would we cluster data that includes categorial variables? Or more complex data structures such as text or images?
- Dimensionality - when the number of variables increases, the dimensionality of the data increases and measures such as Euclidean distance become less useful at distinguishing different points as everything seems "far away" from everything else in a high-dimensional space. This is sometimes referred to as The curse of dimensionality.
- Online learning - How would things change if we only see the data points sequentially and one at a time, rather than all at once?
- Number of clusters - Most clustering methods require a number of clusters to be stated beforehand, but how can we assess how many clusters are in the data?
This project has a focus on data analysis and statistical computation. Familiarity with the statistical package R, general statistical concepts, and data analysis are essential.
Prerequisites
Statistical Inference II
Would be nice/might help, but not essential
Data Science & Statistical Computing II
Web Resources
- The wikipedia pages on Cluster Analysis, Probabilistic unsupervised learning, and Mixture models are a good starting point
- The R task view on cluster analysis and finite mixture models gives a comprehensive list of relevant R packages.
- A good (if a little simple) starting point for cluster analysis would be the book by Everitt
- The Elements of Statistical Learning (Chapters 13+14) provides a good overview of clustering and related problems..
- An Introduction to Statistical Learning (Chapters 12 and 8) provide a gentler overview of the same topics, with focus on using the techniques in R..
- The early chapters in any book on clustering or cluster analysis will cover the background in sufficient detail. Books targeted at a particular application area will likely have less mathematical detail. Many books on multivariate data analysis will also likely touch on this topic.
Further information
Many books contain suitable introductory material: