Clusters, Anomalies, and Bots - Jonathan Cumming
Description
Two key methodologies in practical statistical analysis, machine learning, and data science are cluster analysis (clustering) and classification. Cluster analysis is an exploratory statistical technique which is used to identify natural groupings within a large number of observations. Discovering that there are sub-groups in the data is often valuable information, particularly if our goal is to model these data and the different groups of observations have different properties or behaviours - or else we risk falling into the trap of Simpson's paradox. Cluster analysis can also help us identify groups of data points that appear to be behaving differently than the others; identifying, understanding, and predicting such anomalies can be valuable information for the data set under study. Classification then concerns the subsequent inferential problem: given I know what groups exists within my data, to which group is this new data point likely to belong?.
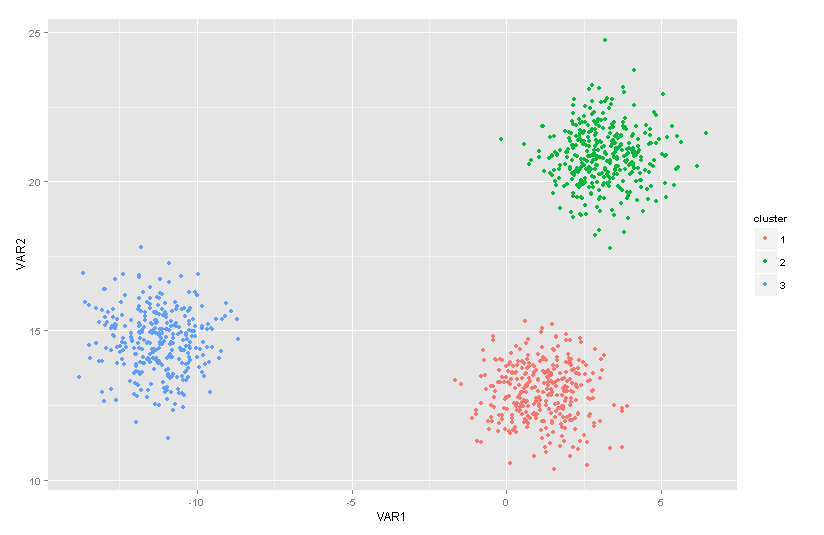
A simple example of a data set with three distinct clusters.
Simple methods for clustering seek to identify sub-groups of the observations which are "similar" to other observations in the same group, but "different" from data in other groups - these groups then constitute the clusters within the data. Methods of classification then use knowledge of this data structure to predict to which group a data new data point might belong. The definition of "similarity" is a crucial one, with different definitions yielding different methodologies - for example, using the Euclidean distance between the data points this leads to a k-Means approach to clustering. There are a similarly broad number of methods for the classification problem depending on whether we use simple distance between points, a full statistical model, or other techniques such as recursive partitioning.
For this project, we have a particular application in mind - namely web activity data. Every visit to a webpage creates a record on the webserver which contains a number of variables (date, time, IP address, address of page visited, page type, etc). A sequence of such page visits is aggregated into a single session with its own data (duration, number of pages visited, time since last session, etc). Clearly, clustering and classification could be applied here to investigate whether there are distinct patterns of user behaviour and provide insight into the key modes of variation. In particular, it could be used to help automatically identify anomalous activity, such as that generated by automated bots that generate unusually high levels of web traffic (relative to a human visitor). For this project, we will be looking at real data supplied for this project by Clicksco.
In this project, you will learn about the key concepts behind cluster analysis and classification. You will study, implement, and apply the standard methods, with the ultimate goal to explore and investigate web activity data to detect and predict anomalous behaviour and any other features of interest. This project has a focus on data analysis and statistical computation, therefore familiarity with the statistical package R, general statistical concepts, programming skills, and practical data analysis are essential.
Prerequisites/Corequisites
Statistical Concepts II, Statistical Methods III
Further information
Many books contain suitable introductory material:
- A good (if a little simple) starting point for cluster analysis would be the book by Everitt
- The Elements of Statistical Learning provides a good overview of statistical learning problems..
- The early chapters in any book on clustering or cluster analysis will cover the background in sufficient detail. Books targeted at a particular application area will likely have less mathematical detail. Many books on multivariate data analysis will also likely touch on this topic.