Maths projects
Statistics for Text Analysis - Jonathan Cumming
Description
It is estimated that there is about 1.8 zettabytes (1.8 trillion GB) of data today, and that 70-80% of that data is unstructured (text documents, notes, comments, surveys with free-text fields, medical charts). While that data is out there, the real problem is not the amount of information but our inability to process it! Unstructured text documents are particularly challenging since language is ambiguous, context-dependent and riddled with inconsistencies and other problems (synonyms, homographs, etc). However, with even simple statistical models of these data, it becomes straightforward (ish) to detect spam emails from your inbox, to classify documents by their type or topic, to compare documents to try and determine their author.
The first challenge is, of course, to transform text information into an appropriate numerical data format that allows us to apply statistical techniques. The simplest approach is to turn a document into a vector of word frequencies, and so a collection of documents simply becomes a collection of observations of word counts over a particular vocabulary (though things are more complicated than that). For example below, we have taken the text of the Project 3 descriptions from last year and reduced each topic to a vector of word frequencies. After some simple processing and normalising, we can represent the most common word frequencies graphically (left), or as a projection into a 2-D numerical space (right). Even using such a simple and aggressive dimension reduction, we begin to see separations between topics on different subjects based on word usage.
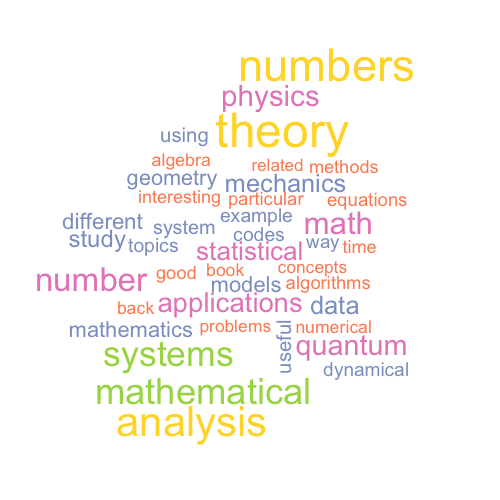
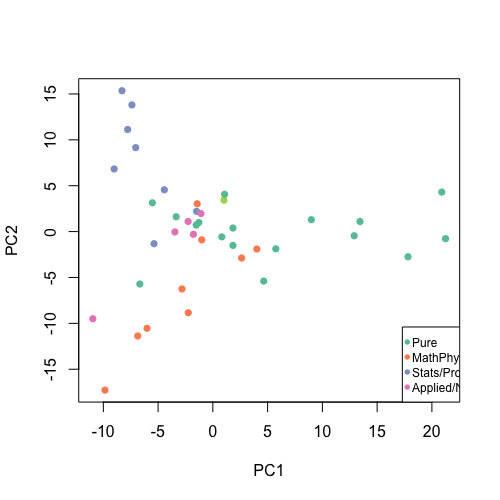
Word cloud (left) for 2015's Project 3 topics based on word frequency, and (right) 2-D projection of topics by area of mathematics.
Once reduced to numerical form, we can apply standard statistical methods to build models, find clusters, to predict the type (or author) of new documents, and so on. However, there are a number of features that make working with text data slightly more challenging than a standard modelling exercise. Typically, the data sets that result are high dimensional (we use many different words are used in a given document), word frequencies are highly variable ('the' and 'an' occur a lot but often have little informational value), the data sets are often sparse (not all documents use the same vocabulary), and simple language models based on word counts often overlook the structure that is important to making sense of the text.
In this project, we will study how we can treat textual information as data which we can understand and model with appropriate statistical techniques. Further topics of study could include:
- Investigating different statistical models for language, such as bag-of-words and n-grams.
- Topic modelling ('what topic is the document about?'), and the latent Dirichlet allocation model.
- Applying these methods to a substantial practical application
- Other topics in natural language processing or related areas.
This project has a focus on statistical methodology and data analysis. Familiarity with the statistical package R (or alternatively Python), statistical concepts and models, and data analysis are essential.
Prerequisites/Corequisites
Statistical Methods III (Bayesian Statistics III/IV could also be useful if studying topic modelling, but not essential).
Further information
- Linked wikipedia pages in the text above.
- Foundations of statistical natural language processing (or similar), available in the Main Library.
- Text mining and topic models
- Bag of Words Meets Bags of Popcorn - a tutorial on natural language processing using IMDB film reviews (more machine learning than statistics, however).
- The R Task View on natural language processing overviews useful packages in this area.